PRODUCT
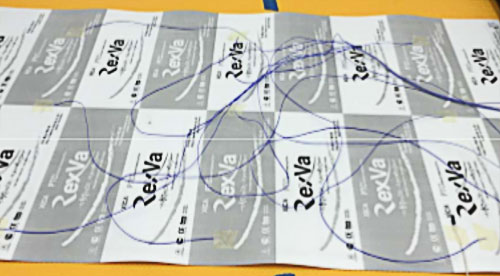
Premium PTC Film temperature performance test
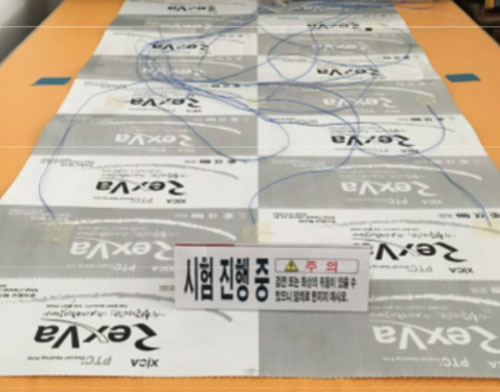
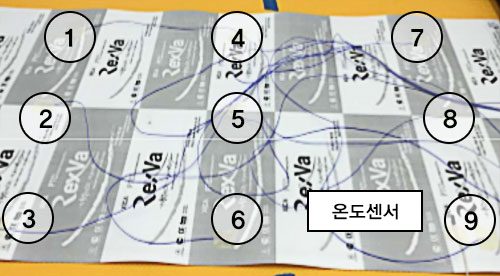
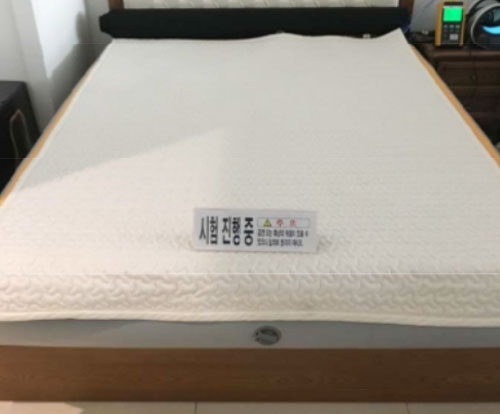
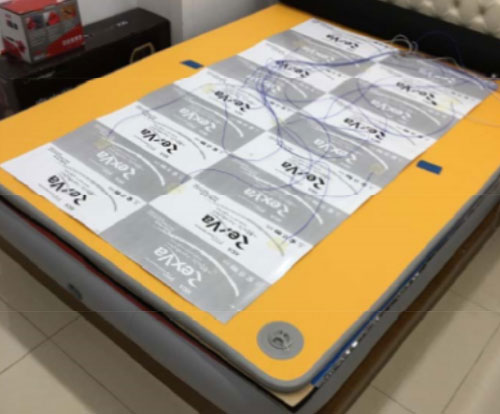
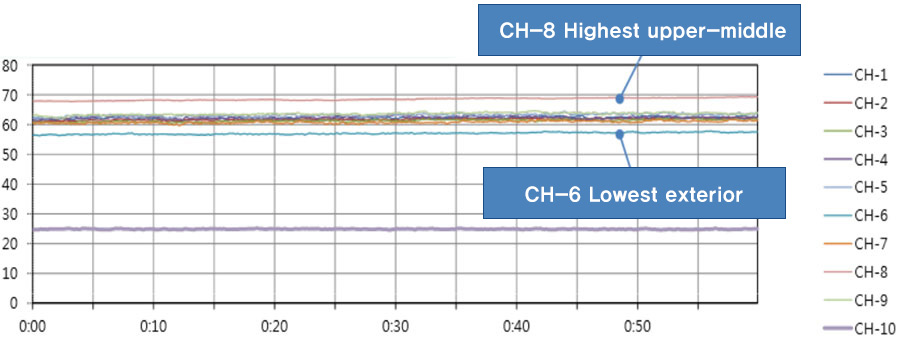
After installing the temperature 5kΩ sensor and setting the maximum temperature, the following is the result of covering a thin blanket.
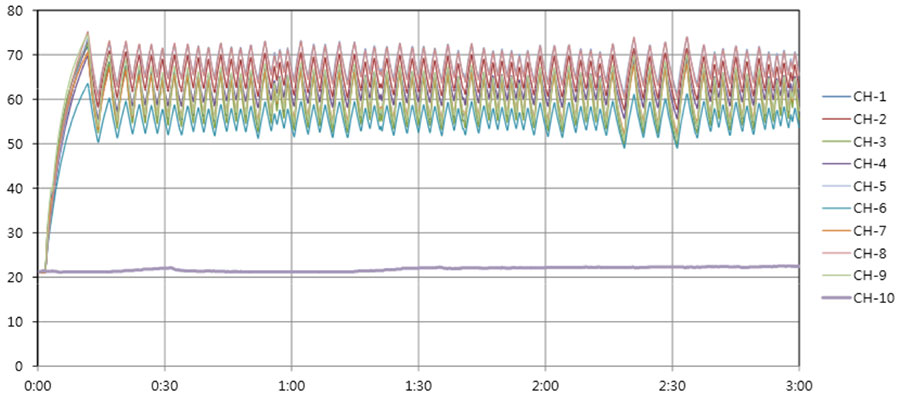
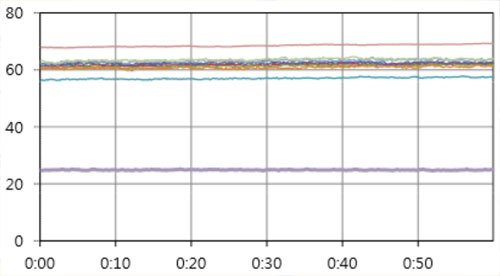
| Elapsed time | Average temperature value for each channel(1 hours) | MAX | MIN | RANGE | |||||||||
| CH-1 | CH-2 | CH-3 | CH-4 | CH-5 | CH-6 | CH-7 | CH-8 | CH-9 | CH-10 | ||||
| After 1hour | 62.2 | 61.7 | 61.3 | 62.4 | 63.2 | 57.0 | 60.8 | 68.5 | 63.6 | 24.9 | 68.5 | 57.0 | 11.5 |
| After 2hour | 62.9 | 62.1 | 61.9 | 62.4 | 63.9 | 57.7 | 61.5 | 69.3 | 64.1 | 24.8 | 69.3 | 57.7 | 11.6 |
| After 3hour | 63.6 | 62.3 | 62.1 | 62.5 | 64.1 | 58.0 | 61.8 | 69.8 | 64.0 | 24.6 | 69.8 | 58.0 | 11.8 |
| After 4hour | 64.1 | 62.6 | 62.2 | 62.7 | 64.5 | 58.2 | 62.2 | 70.4 | 64.1 | 24.5 | 70.4 | 58.2 | 12.2 |
| After 5hour | 64.0 | 62.1 | 62.2 | 62.5 | 64.3 | 57.9 | 61.8 | 70.2 | 63.8 | 24.2 | 70.2 | 57.9 | 12.3 |
| After 6hour | 63.8 | 62.0 | 62.2 | 62.1 | 64.2 | 57.7 | 61.7 | 69.9 | 63.6 | 24.1 | 69.9 | 57.7 | 12.2 |
| After 7hour | 63.5 | 61.9 | 62.2 | 61.6 | 63.9 | 57.5 | 61.5 | 69.5 | 63.3 | 24.0 | 69.5 | 57.5 | 12.0 |
| After 8hour | 63.8 | 62.3 | 62.7 | 61.9 | 64.3 | 57.8 | 61.9 | 69.8 | 63.7 | 24.0 | 69.8 | 57.8 | 12.1 |
| 9시간 후 | 63.6 | 62.1 | 62.5 | 61.8 | 64.1 | 57.6 | 61.9 | 69.6 | 63.5 | 23.9 | 69.6 | 57.6 | 12.0 |
| After 10hour | 63.9 | 62.3 | 62.7 | 62.0 | 64.4 | 57.8 | 62.4 | 69.8 | 63.8 | 23.9 | 69.8 | 57.8 | 12.1 |
Test Purpose
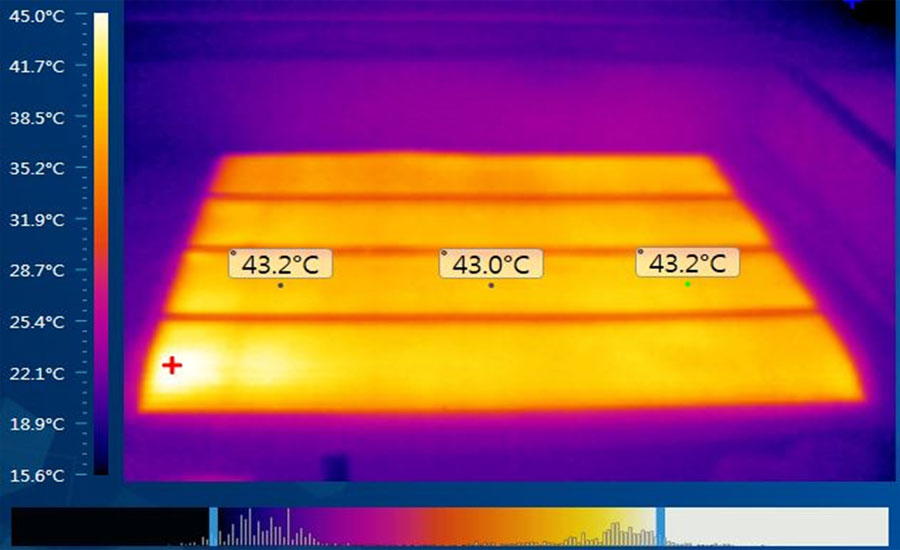
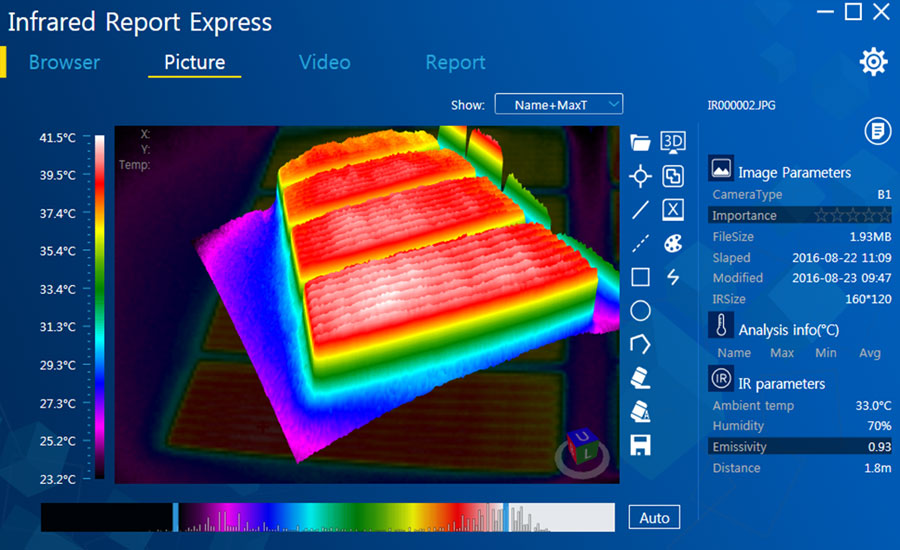
Test Condition
| Section 1 | Section 2 | Section 3 | ||||||||||
| Time(min) | 5 | 10 | 15 | 20 | 5 | 10 | 15 | 20 | 5 | 10 | 15 | 20 |
| Temperature1 | 42.63 | 42.56 | 42.99 | 43.12 | 42.47 | 42.77 | 43.14 | 43.03 | 42.27 | 43.17 | 42.72 | 42.86 |
| Temperature2 | 42.13 | 42.41 | 42.57 | 42.75 | 43.73 | 43.76 | 44.25 | 44.33 | 42.57 | 42.68 | 42.81 | 42.74 |
| Temperature3 | 39.95 | 39.84 | 39.81 | 40.13 | 39.36 | 39.60 | 39.76 | 39.60 | 40.78 | 40.93 | 41.02 | 41.46 |
| Room temperature | 14.37 | 14.33 | 14.24 | 14.12 | 14.71 | 14.43 | 14.80 | 14.62 | 15.40 | 15.40 | 15.69 | 15.17 |
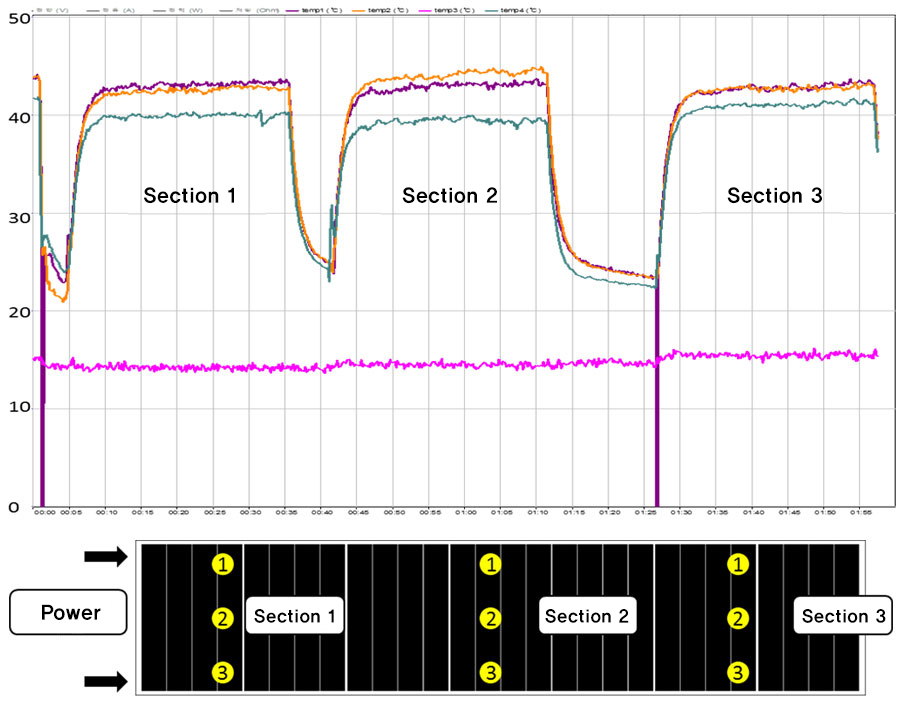

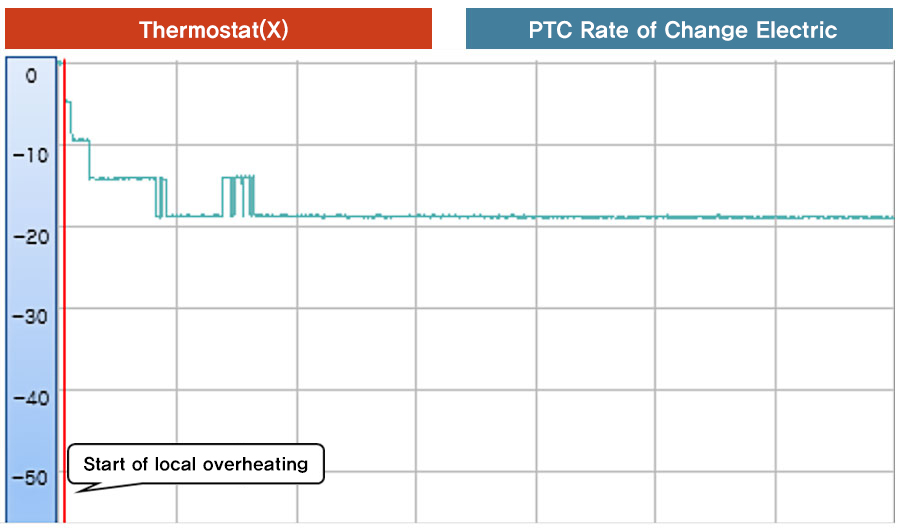
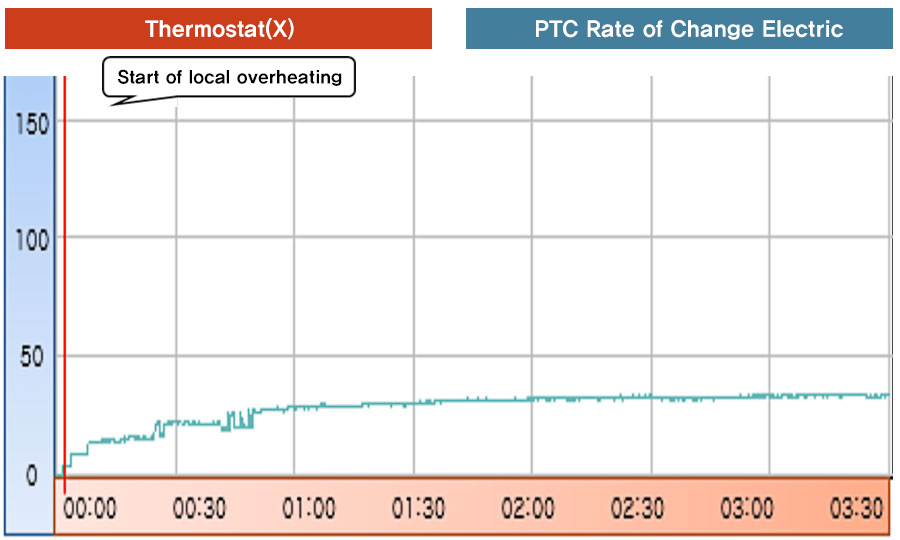
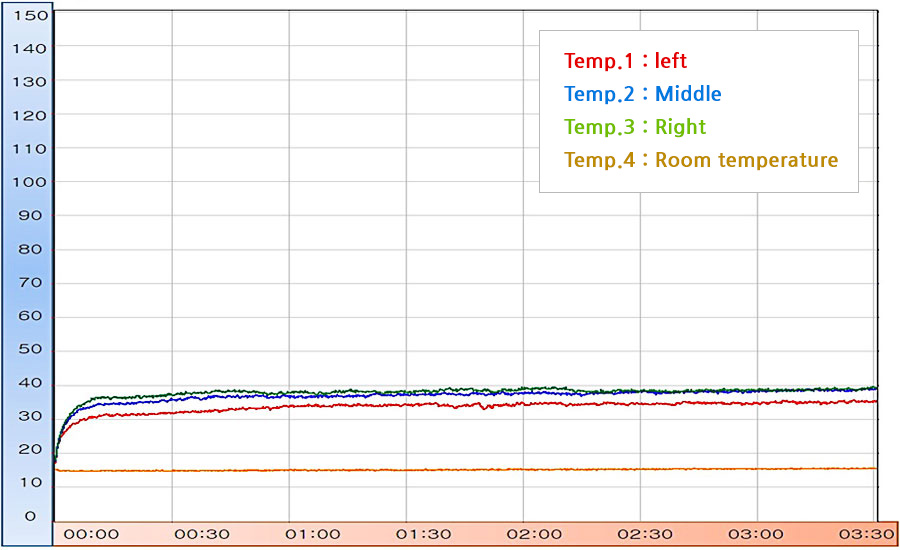
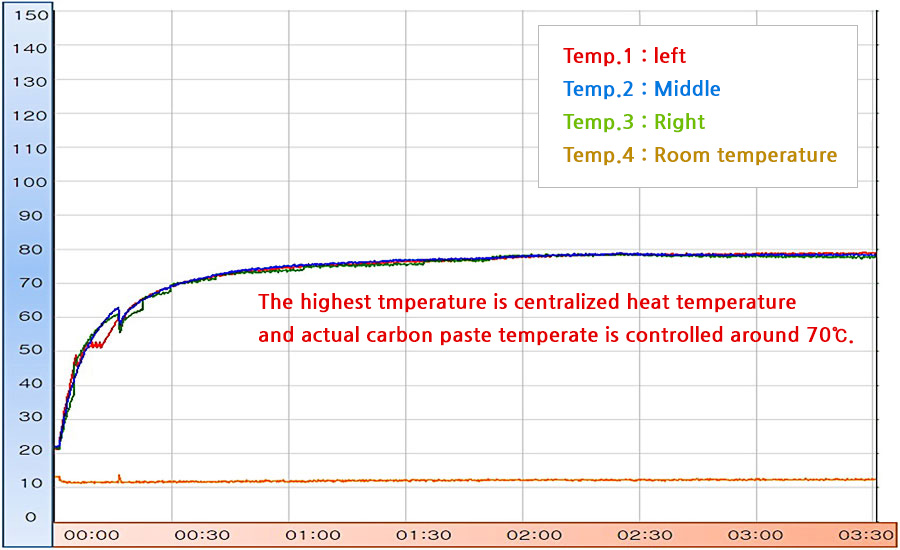
Normal heating film has tendency for centralized heating when local overheating occurs.
Heat dispersion test shows central heat shows lesser temperature than the side temperature which can solve local overheating that occurs